Indicators
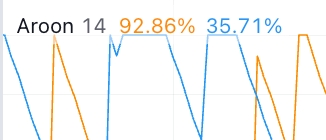
Indicators are used along with charts to provide additional insights for trading decisions. Your platform contains 50+ indicators to assist in trading.
Adding Indicators
Indicators can be added from a chart of any type. The list of indicators is accessed by first clicking the Indicators button on the top of the chart.

Indicator Settings
Once indicators are selected and appear in the Added Indicators section, you can edit settings by hovering over the indicator and clicking the Settings icon ![]() . Each indicator will have its own settings specific to the indicator, but there are some settings that are common across all indicators.
. Each indicator will have its own settings specific to the indicator, but there are some settings that are common across all indicators.
You can also double-click the indicator in the object tree to edit settings.

The settings details for some of the common indicator settings are described below:
Length
The time period used in calculating the moving average
Plot
The checkmark determines whether the indicator is visible on the chart. You can also configure line style, color, and thickness. For indicators with multiple values, or lines, you will see a configuration item for each.
Precision
Numerical value determines the number of decimal points displayed on the axis.
Labels on price scale
Enabling includes pertinent indicator labels on the price scale.
Values in status line
Enabling will display the indicator values on the status line.

Minutes
Determines where the indicator will be displayed, 1-60 minutes in an hour
Hours
Determines where the indicator will be displayed, 1-24 hours in a day.
Days
Determines where the indicator will be displayed, 1-31 days in a month.
Weeks
Determines where the indicator will be displayed, 1-52 weeks in a year.
Months
Determines where the indicator will be displayed, 1-12 months in a year.
To learn more about settings for specific indicators, visit TradingView's Indicators KB.
Arranging Indicators
Moving Indicators Up or Down
Indicators can be moved up and down on the screen by clicking the up or down arrows on the screen.

Visual Order
Indicators, along with other components on the chart, such as pricing graphs, can be ordered visually (i.e. bring forward or send back) by right-clicking and selecting the desired option in the Visual Order dropdown.
Combining Indicators
You can combine indicators by opening the Object Tree, selecting the indicator and dragging it to another indicator in the object tree.

Indicators can be separated by selecting the desired indicator, clicking the UpDown icon ![]() and selecting whether to move to a new pane above or below.
and selecting whether to move to a new pane above or below.

Collapsing, Expanding, and Maximizing
Collapse indicator views by clicking the collapse button ![]() on the right side of the chart.
on the right side of the chart.
Restore panes by clicking the restore pane button ![]() on the right side of the chart.
on the right side of the chart.

Maximize the pane by clicking the maximize button ![]() on the right side of the chart. It can then be restored by clicking the same button again.
on the right side of the chart. It can then be restored by clicking the same button again.
Hiding Indicators
Indicators can be hidden from view, while the pane will still be maximized. Indicators can be hidden by clicking the hide button on the indicator within the chart or in the Object Tree.


Removing Indicators
There are three places you can remove indicators. Remove an indicator by clicking the remove button on the right side of the panel, clicking the remove button on the indicator, or removing from the object tree.

Remove all indicators at once by right-clicking anywhere on the chart and selecting Remove Indicators.

Last updated

