

Drawing Tools
Drawing tools aid traders with the ability to create dynamic, interactive visuals that are paired with charts to assist in decision-making. Your platform offers more than 40 drawing tools.
Adding Drawings
Drawing tools can be accessed on the left side of any chart. Clicking the expand icon will display the full list of tools.

A drawing can be added to a chart by selecting the drawing from the menu on the left and dragging it onto the desired point on the screen.
Drawings will have various requirements for how they're added and configured, depending on which type of drawing. Most drawings are configured by starting with one initial point and dragging your cursor to the appropriate positioning on the chart for any subsequent points. All points on a drawing are editable by clicking and dragging to the desired position.
Configuring Drawings
Appearance Settings
When adding and/or selecting an existing drawing on the chart, a small settings bar is active for whichever drawing is selected.
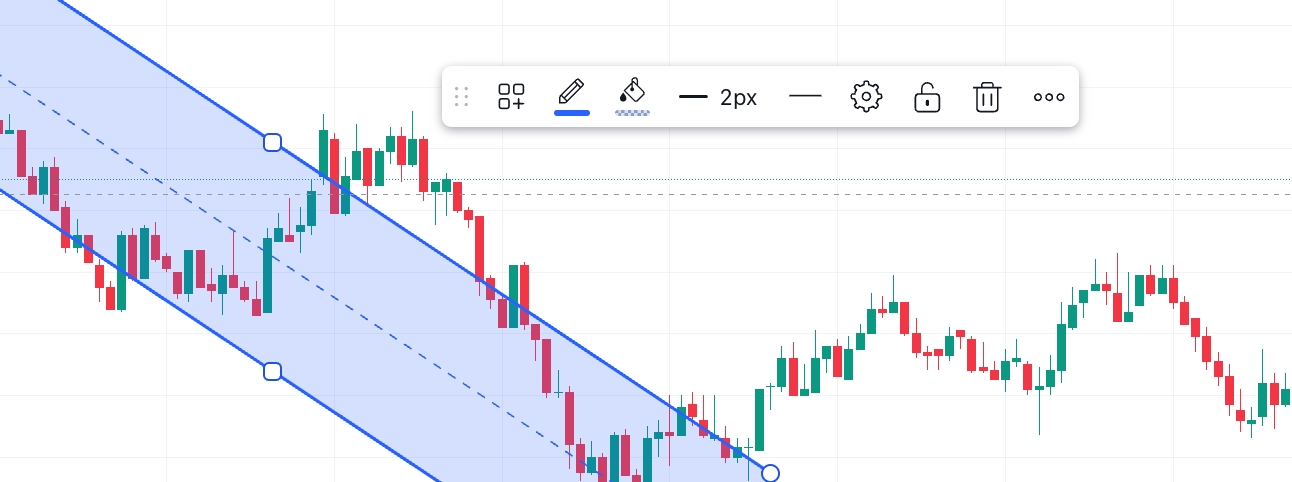
For almost all drawings (excluding some drawings such as emojis, arrows, etc.) the color and line thickness can be configured.
To configure color, select the color icon and choose your desired color from the color wheel. Line / edge thickness and type (dashed or straight line) can be configured by selecting the edge icon.
Style and Text Settings
For many drawings, style and text can be configured by clicking the settings ![]() gear.
gear.
Examples of style settings include:
Extend Left
Extend the drawing left on the chart in perpetuity. Generally an option for rectangle and line drawings.
Extend Right
Extend the drawing right on the chart in perpetuity. Generally an option for rectangle and line-based drawings.
Price Labels
Enable to display pricing labels
Background
Configure background color / pattern for drawings. Generally an option for geometric shapes and some patterns.
Label
Configure display of labels for drawings that
Stats Settings
Informational statistics can be added along with the drawing. To configure, navigate to Style settings and to the Stats section.
Stats can be enabled by selecting the checkbox for the stat you wish to see and clicking Ok. The stats will appear adjacent to the drawing immediately upon enabling the checkbox.

Charting Settings
While all drawing tools are unique, there are some common settings that apply to many drawings. This section covers the charting settings.
To navigate to charting settings, select the desired drawing on the chart and click the settings ![]() gear. The settings modal can be moved anywhere on the chart in order to see the changes while editing.
gear. The settings modal can be moved anywhere on the chart in order to see the changes while editing.
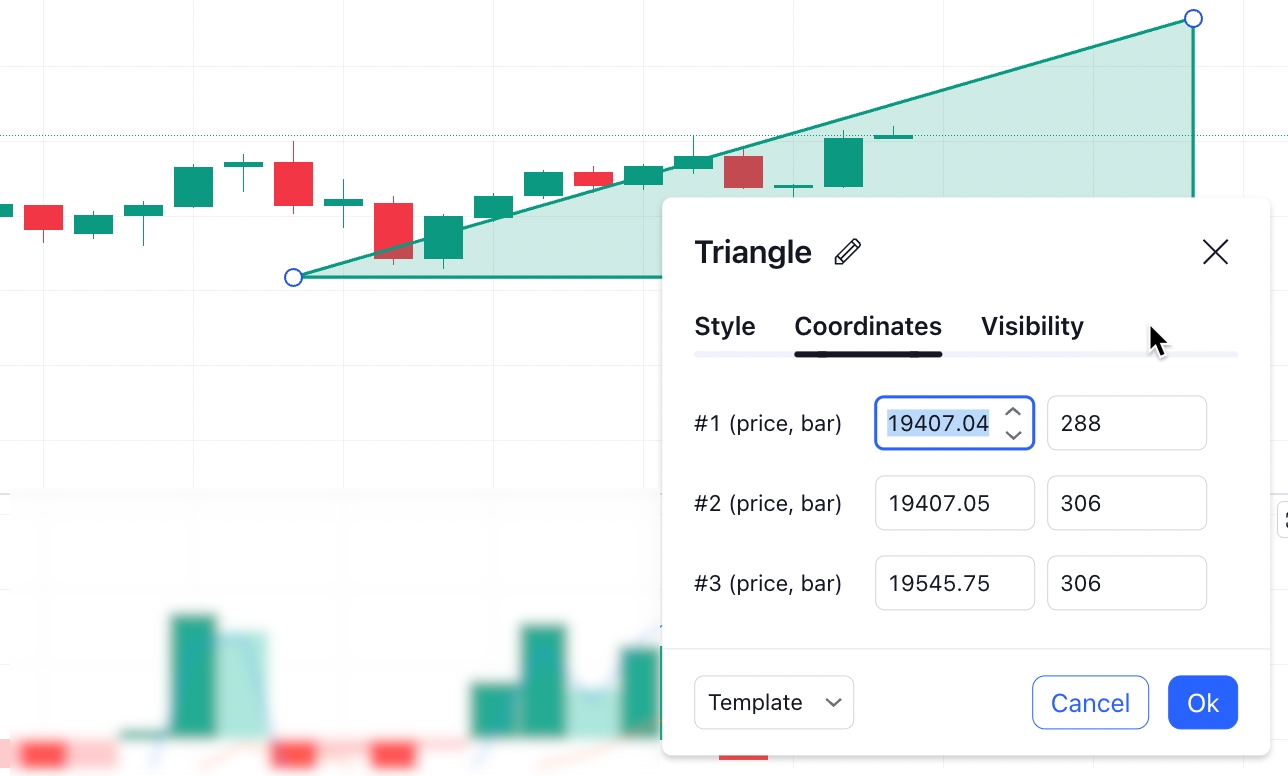
Coordinate Settings
Drawings contain coordinates that can be configured by moving the drawing on a map, or fixing the edge(s) to a specific price, date, bar or time in Coordinates settings.
Visibility Settings
Visibility settings are configured by selecting the visibility interval when right-clicking on the drawing, or navigating to the settings and adjusting the visibility manually by adjusting minutes, seconds, hours, days, weeks, or months.
Naming Drawings
Many drawings can be named in order to assist in categorizing and labeling drawings for the intended purpose. You can name drawings via the settings screen or by double-clicking on the drawing in the object tree.

Locking and Hiding Drawings
Locking Drawings
Drawings can be locked individually, as a group, or all at once. To lock individual drawings, click the lock icon on the chart or on the object tree.

Groups of drawings can be locked from the object tree by clicking the lock icon for the group.
To lock all drawings on the chart, click the lock icon on the left side of the screen.

Hiding Drawings
Similar to locking drawings, you can hide drawings at the individual, group, or total level.

Grouping Drawings
Group drawings together on the chart by clicking the create group icon ![]() in the object tree.
in the object tree.
To add a drawing to a group, drag the drawing to the group on the object tree. To remove, drag it outside of the group in the object tree.
Deleting Drawings
Drawings can be deleted simply by selecting the drawing in the chart and hitting the Delete button on your keyboard, or by clicking the trash icon on the chart settings popup.
To delete all drawings, click the Delete all Drawings button at the bottom of the Drawing Tools menu.
Last updated