Trading Dashboard
The Trading Dashboard displays a consolidation of trading statistics to provide insights into your trading performance. The dashboard can be configured to display specific date ranges, asset types, and you can filter by specific securities.
Accessing the Dashboard
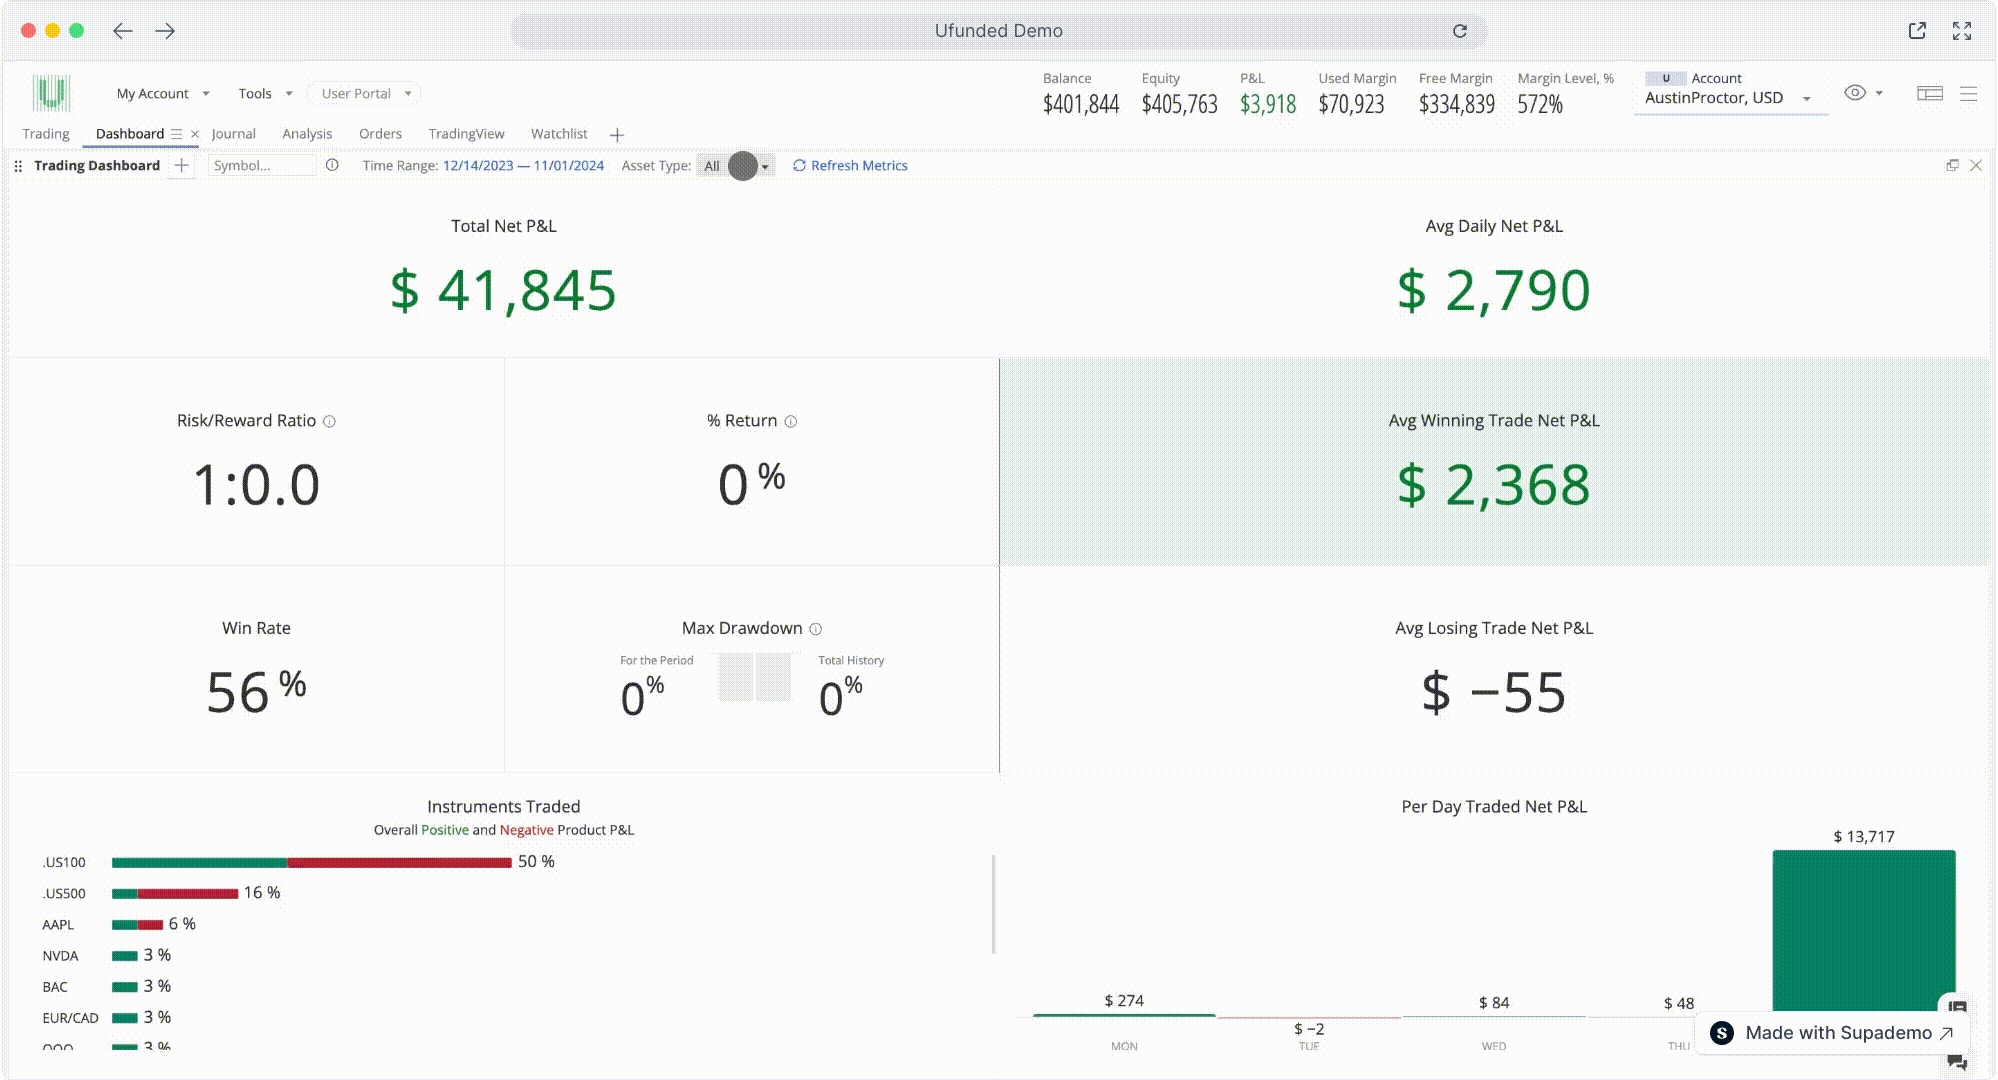
Dashboard Overview
The dashboard contains aggregated statistics covering the trades executed during the date range selected. The figures are detailed below:
Total Net P&L
Total Net Profit and Loss for the selected period and selected aggregation level (calculated including commission and financing)
Risk/Reward Ratio
Average proportion of expected risk, which is expected loss defined by Stop Loss price, and reward which is expected profit defined by Take Profit price
% Return
Total return on investment, expressed by percentage, during the filtered trading period.
Win Rate
Winning trades as a percent of all trades executed
Max Drawdown
Maximum percentage of equity decline caused by losses
Instruments Traded
Displays all instruments traded, along with total number of trades executed for each instrument as a percentage of all instruments traded.
Avg Daily Net P&L
Average daily Net Profit and Loss for the selected period and selected aggregation level (calculated including commission and financing)
Avg Winning Trade Holding Time
Average time spent holding winning trades
Avg Losing Trade Holding Time
Average time spent holding losing trades
Avg Winning Trade Net P&L
Average Net Profit and Loss across all winning trades
Avg Losing Trade Net P&L
Average Net Profit and Loss across all losing trades
Per Day Traded Net P&L
Average daily Net Profit and Loss for the selected period and selected aggregation level, grouped by weekdays
Filtering by Time Range
The dashboard aggregates statistics based on the time range set. To filter by time range, click the dates at the top of the screen. You can select by date or one of the preset options.
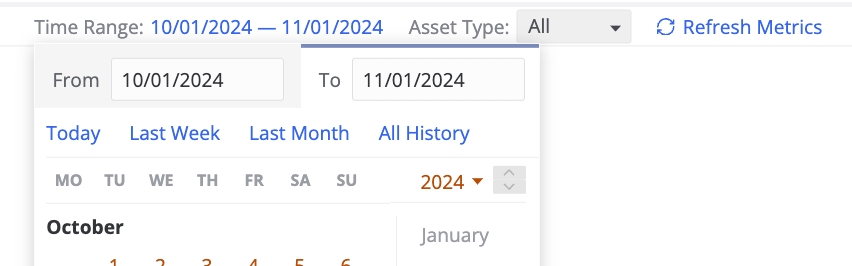
Upon adjusting the time range, the dashboard metrics will update immediately.
Filter by Asset Type
To filter the dashboard by asset type, select the Asset Type dropdown on the top of the trading dashboard.
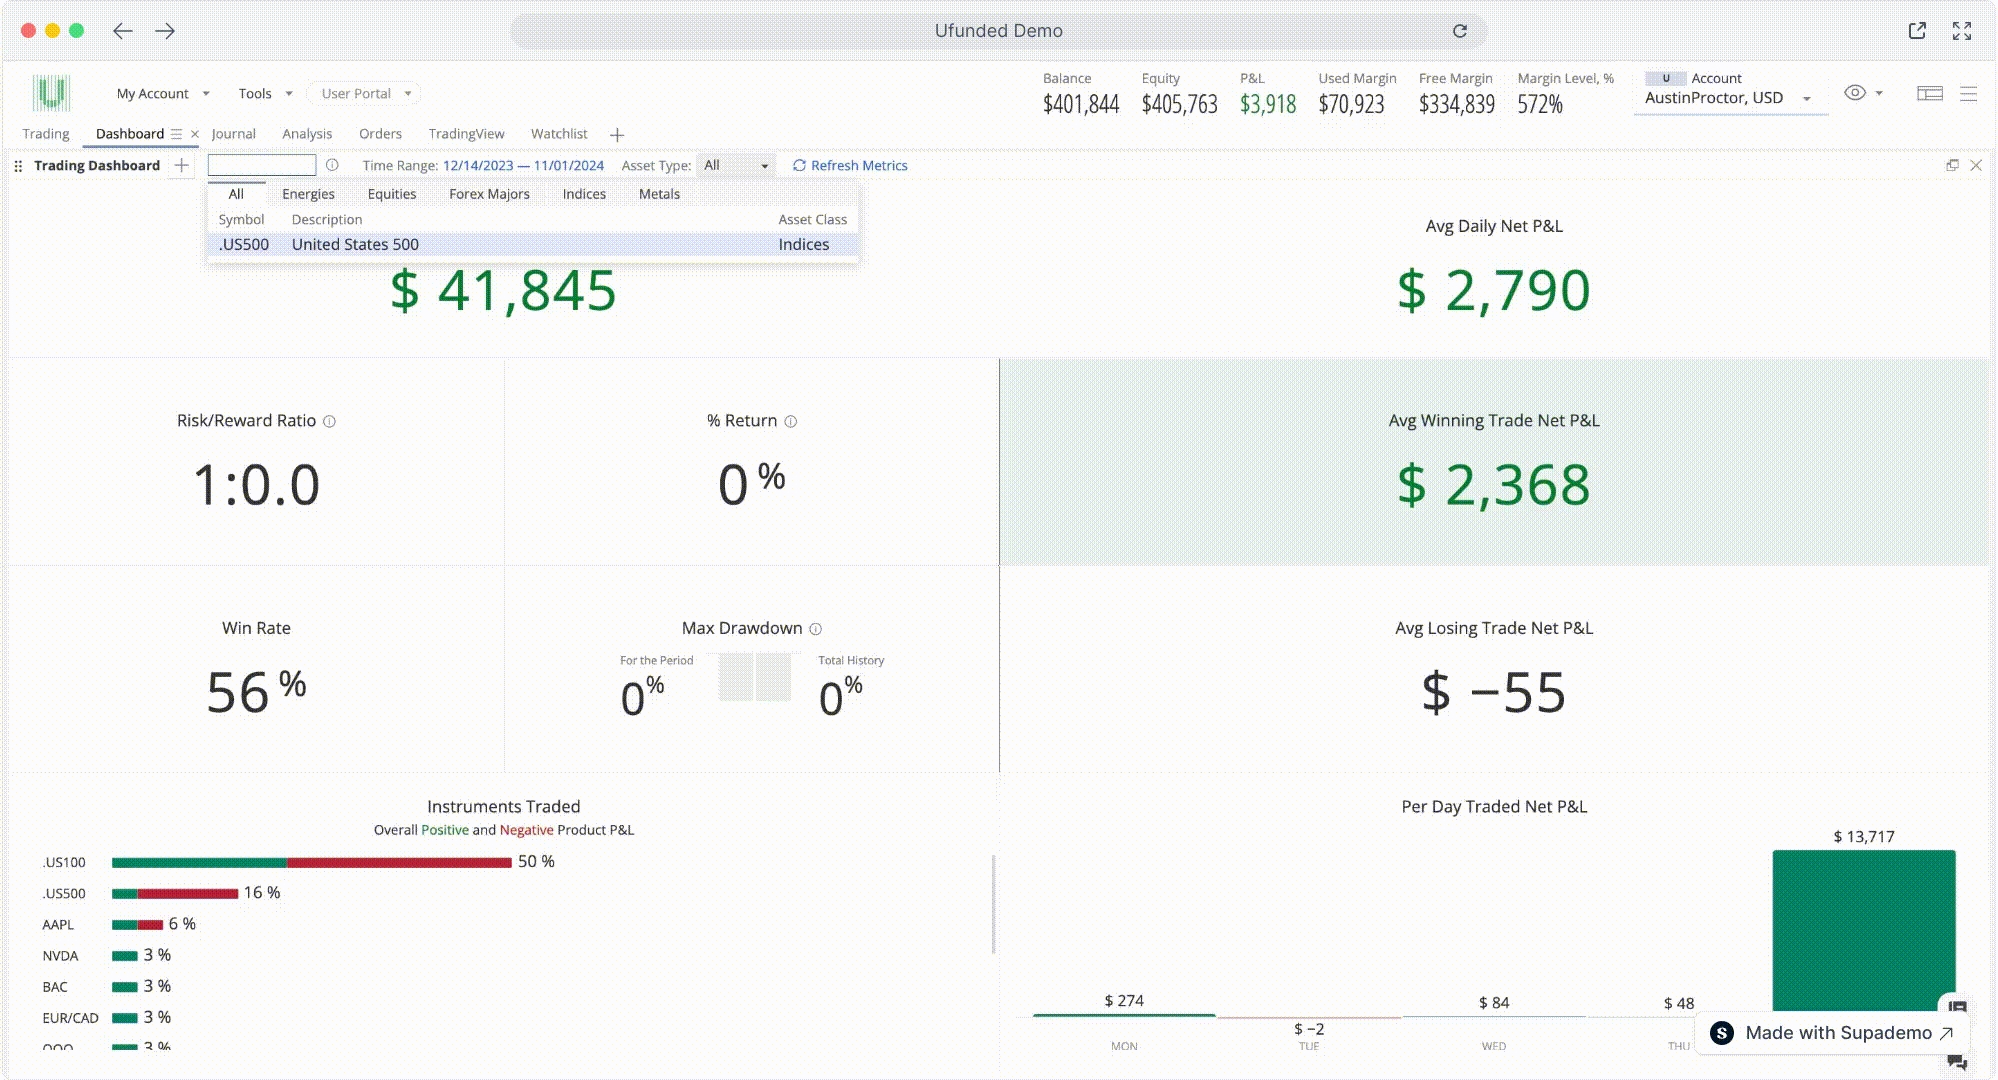
Filter by Instrument
The trading dashboard can be filtered by specific instruments to assess trading performance at an individual instrument level. To filter by instrument, enter the instrument in the search bar at the top of the dashboard.