

Symbol
The chart symbol settings can be found by navigating to the chart and clicking gear icon on the right side of the chart.

The Chart Settings modal will appear, with Symbol selected.
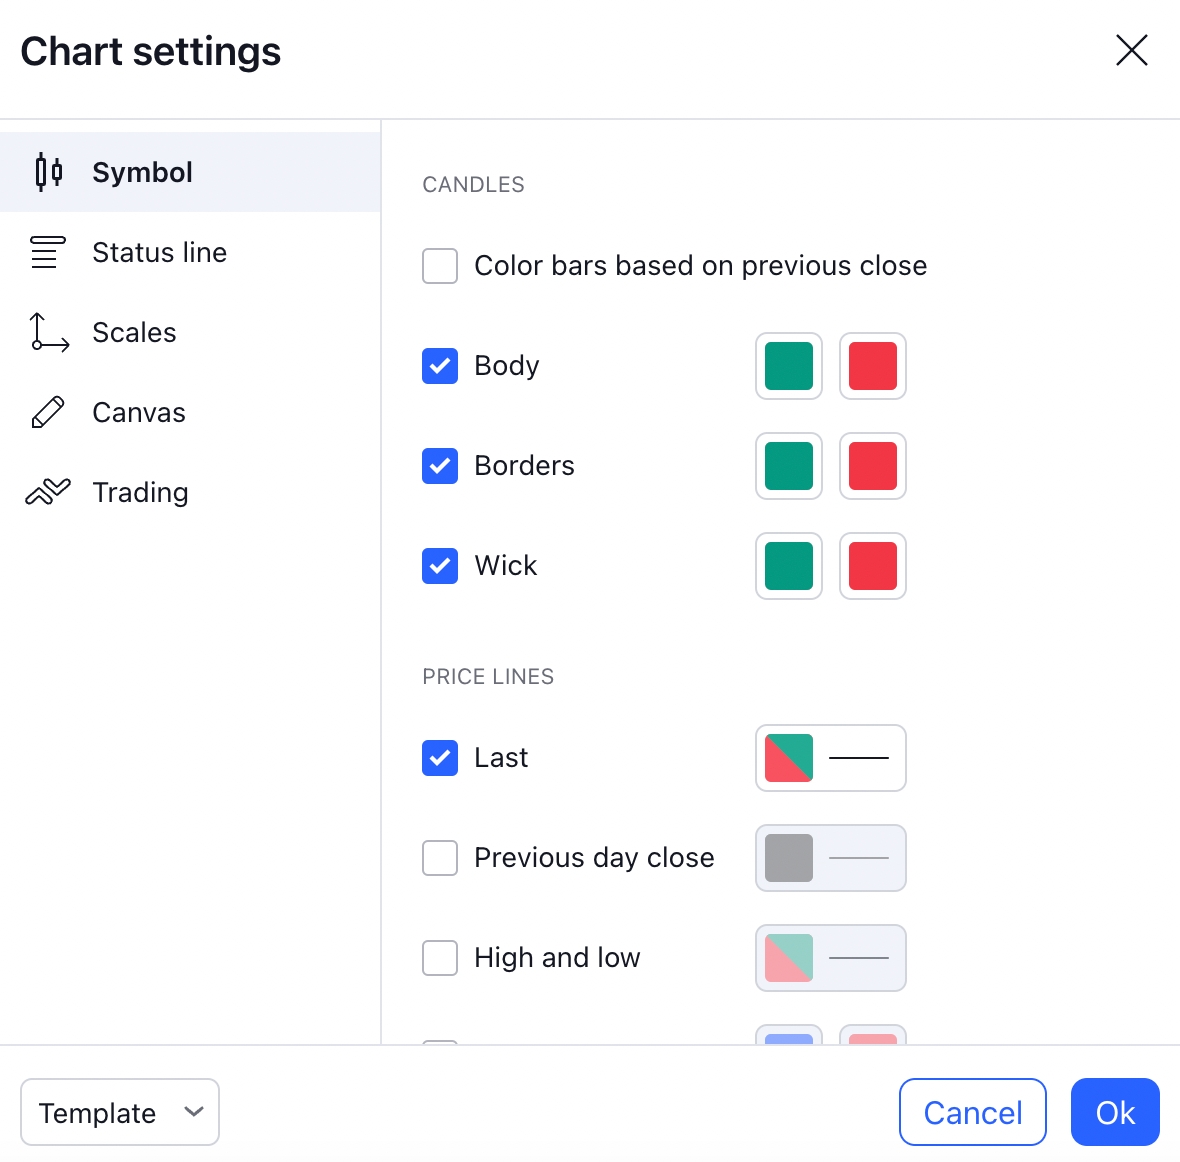
The symbol settings are detailed below:
Candle Settings
Color bars based on previous close
Enabling this will update the coloring of the bars to display gain / loss colors based on the previous period.
Body
Selecting the checkbox fills the body with the colors specified for upward or downward price movements.
 Unselecting the checkbox removes the body from view. (If the Borders setting is enabled, the border will still be displayed.)
 The left color selector allows configuration of color for upward price movements, and the right selector allows configuration for downward price movements.

Borders
Selecting the checkbox displays the borders with the colors specified for upward or downward price movements.
 Unselecting the checkbox removes the borders from view. (Example below also displays body unselected)
 The left color selector allows configuration of color for upward price movements. (Example above)
The right color selector allows configuration of color for downward price movements. (Example above)
The left color selector allows configuration of color for upward price movements. (Example above)
The right color selector allows configuration of color for downward price movements. (Example above)
Wick
Selecting the checkbox displays the wick with the colors specified for upward or downward price movements. Unselecting the checkbox removes the wick from view. The left color selector allows configuration of color for upward price movements. (Example above) The right color selector allows configuration of color for downward price movements. (Example above)
Price Line Settings
Last
Selecting the checkbox displays the last price as a line on the chart for the trading period with the color specified.
Previous day close
Selecting the checkbox displays the previous day close price as a line on the chart with the color specified.
High and low
Selecting the checkbox displays the high and low price values as lines on the chart for the period in view with the color specified.
Bid and ask
Selecting the checkbox displays the bid and ask values as lines on the chart for the period in view with the color specified.
Data Modification Settings
Precision
Precision configuration allows the configuration of decimal numbers for pricing display on the chart.
Timezone
Timezone configuration allows you to set the timezone in which to display the times on the chart.
Last updated