

Scales
The chart scales settings can be found by navigating to the chart and clicking gear icon on the right side of the chart and selecting Scales.

The scale settings are detailed below:
Labels on Price Scale Settings
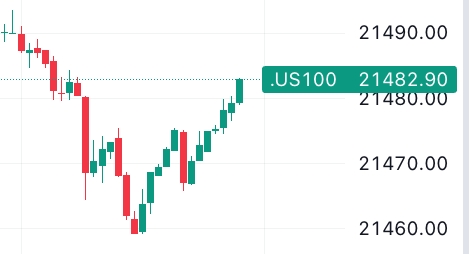
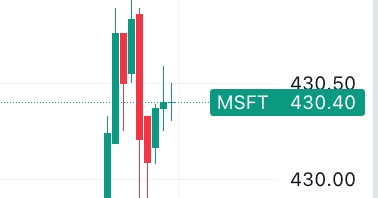
Symbol name
Enabling displays symbol name beside the price.
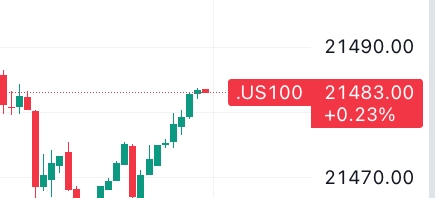
Symbol last price
Enabling displays symbol's last price. Percentage gain/loss value can optionally be displayed.
Symbol previous day close price
Enabling displays the previous day's closing price.
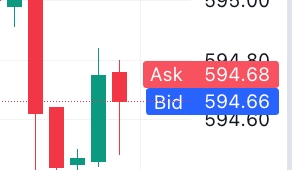
Bid and ask
Enabling displays current Bid and Ask.
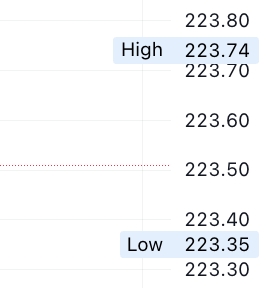
High and low price
Enabling displays High and Low prices from current trading period.
Price Scale Settings
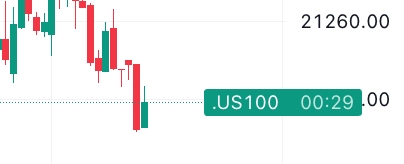
Countdown to bar close
Enabling displays a countdown timer until the current bar closes.
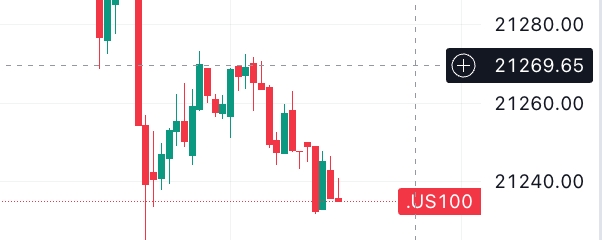
Plus button
Enabling displays a button on the axis that follows the cursor and can be pressed to create a new order.
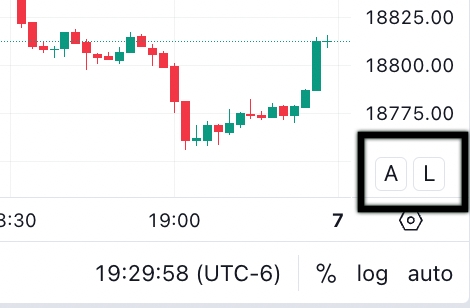
Scale modes (A and L)
Determines whether A and L scale options are visible on the bottom-right of the chart. Options are: Visible on mouse-over, Always visible, or Always invisible.
A = Auto
L = Logarithmic
Lock price to bar ratio
Enabling locks the price axis to the bars, meaning the price values on the axis will adjust as you zoom or scroll. You can set the ratio to determine responsiveness of the axis.
Scales placement
Setting option for placement of scale location (Left, Right, or Auto).
Time Scale Settings
Date Format
Allows you to select date format, for date display throughout the charting tool.
Time hours format
Allows you to select time hours format, for time display throughout the charting tool.
Last updated